Yishun North has been identified as the most crime-prone estate in Singapore, according to a study conducted by financial research analysts ValuePenguin.
Methodology
The analysis relied on crime data recorded by Neighbourhood Police Centres and compiled by the Singapore Police Force from 2012 to 2016.
Research analyst William Hoffman then identified five districts with the least amount of crimes reported and five others that are more prone to criminal activities.
The neighbourhood rankings take into account a wide range of crimes including robbery, housebreaking, snatch theft, motor vehicle theft, unlicensed moneylending and unlicensed moneylending harassment.
Safest
The five safest estates are:
Bukit Timah
Bishan
Kampong Java
Marine Parade
Sembawang
The five more crime-prone estates are:
Yishun North
Nanyang
Jurong West
Tampines
Woodlands East
Here is a table:
| Rank | Neighbourhood | No. of Crimes 2016 | Average No. of Crimes (2012 - 2016) |
|---|---|---|---|
| 1 | Bukit Timah | 51 | 69.4 |
| 2 | Bishan | 72 | 127.8 |
| 3 | Kampong Java | 76 | 127.4 |
| 4 | Marine Parade | 80 | 106.0 |
| 5 | Sembawang | 83 | 121.4 |
| 6 | Marina Bay | 96 | 118.0 |
| 7 | Serangoon | 105 | 184.6 |
| 8 | Changi | 108 | 223.2 |
| 9 | Bedok South | 111 | 190.0 |
| 10 | Queenstown | 122 | 220.4 |
| 11 | Bukit Merah West | 125 | 212.2 |
| 12 | Punggol | 131 | 138.3 |
| 13 | Jurong East | 132 | 235.4 |
| 14 | Ang Mo Kio South | 134 | 233.6 |
| 15 | Orchard | 139 | 145.8 |
| 16 | Pasir Ris | 139 | 253.6 |
| 17 | Bukit Merah East | 140 | 260.8 |
| 18 | Rochor | 141 | 239.4 |
| 19 | Clementi | 144 | 234.0 |
| 20 | Yishun South | 145 | 184.8 |
| 21 | Toa Payoh | 161 | 281.4 |
| 22 | Ang Mo Kio North | 178 | 283.6 |
| 23 | Bukit Panjang | 200 | 304.2 |
| 24 | Woodlands West | 202 | 258.6 |
| 25 | Bukit Batok | 205 | 332.0 |
| 26 | Sengkang | 227 | 357.2 |
| 27 | Bedok North | 227 | 420.8 |
| 28 | Hougang | 232 | 454.8 |
| 29 | Geylang | 232 | 363.6 |
| 30 | Choa Chu Kang | 245 | 385.6 |
| 31 | Woodlands East | 259 | 430.4 |
| 32 | Tampines | 266 | 449.8 |
| 33 | Jurong West | 275 | 391.0 |
| 34 | Nanyang | 280 | 456.4 |
| 35 | Yishun North | 284 | 327.6 |
Limitations
There are a few limitations with the available data though.
For a start, it does not allow for simple population or geographic area standardisation.
As a result, this study could not be about crime per person or per square meter of area.
Instead, this required the study to be based on the total number of crimes committed in each planning area.
But the data still gives a sense of how unlikely it is to encounter a crime in each neighbourhood?
[related_story]
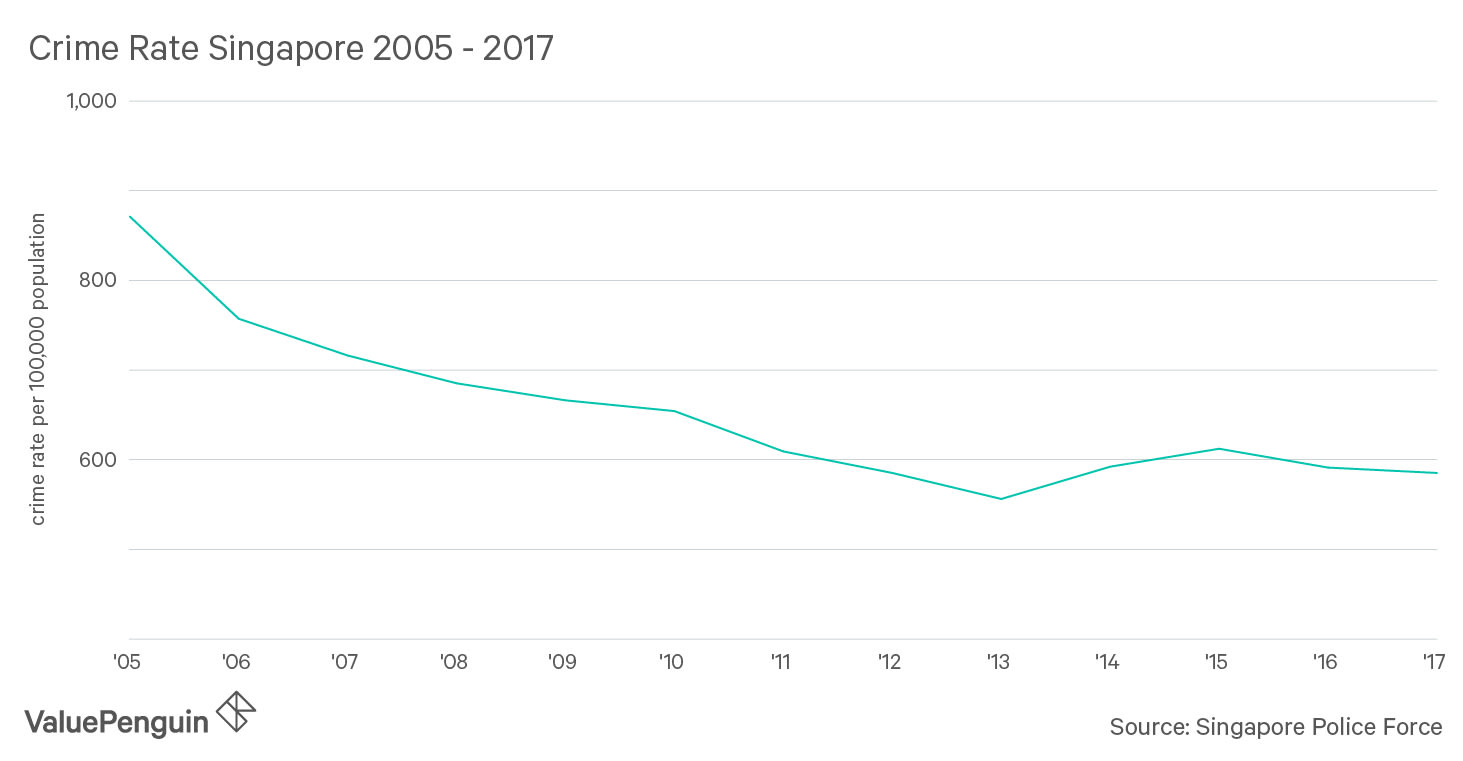
Crime decreasing
The good news, though, is that crime has been on a downward trend in Singapore since 2015:
Top photo via Yishun North NPC
If you like what you read, follow us on Facebook, Instagram, Twitter and Telegram to get the latest updates.