
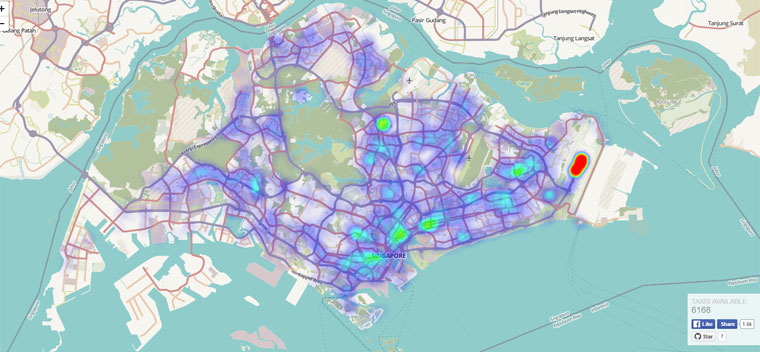
Some of you might have seen, through our earlier article or elsewhere on the net, the taxi heat map that shows you, down to the minute, a real-time snapshot of where Singapore's taxis are, as well as the number of taxis available at that moment.
As it turns out, the map's creator, first-year National University of Singapore undergraduate Joseph Tang, is no one-trick pony. Here are some other things he's done, some of which you might have seen before:
1. Mapped the available parking space in various shopping malls.
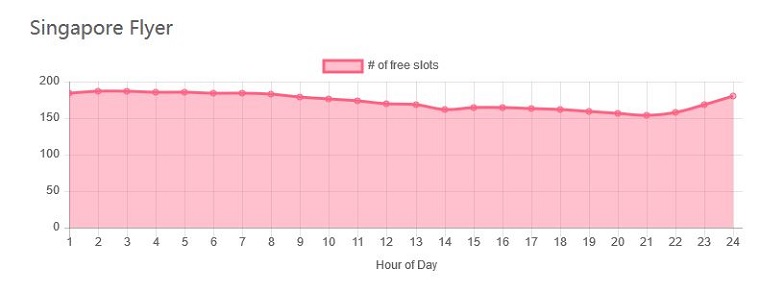
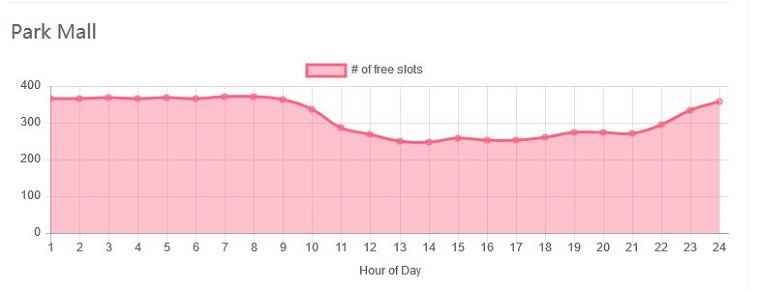
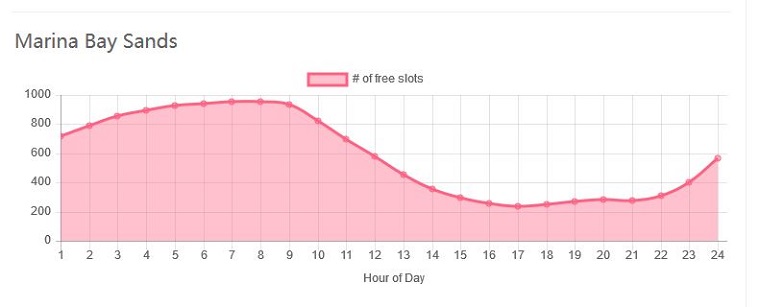 Screenshots from Joseph's NUS page
These help better visualise when exactly the peak period for cars in shopping mall car parks are.
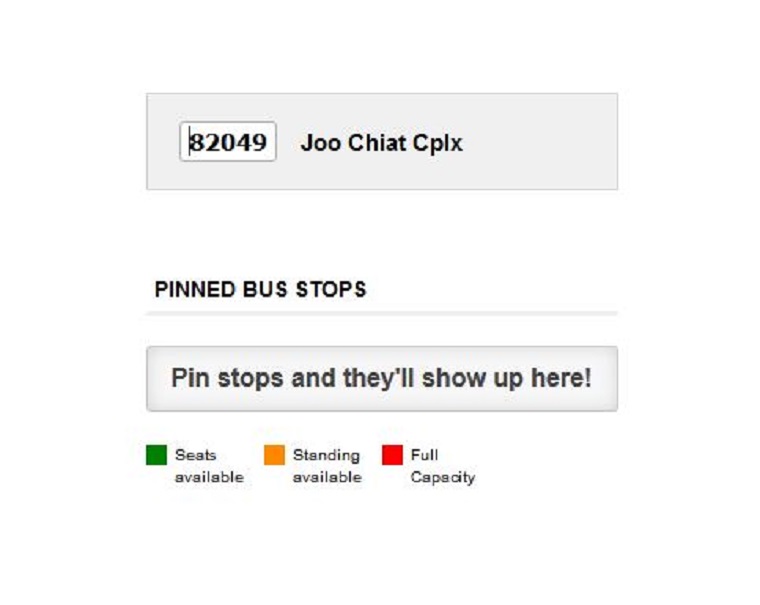
2. Redesigned Gothere.sg's mobile platform...
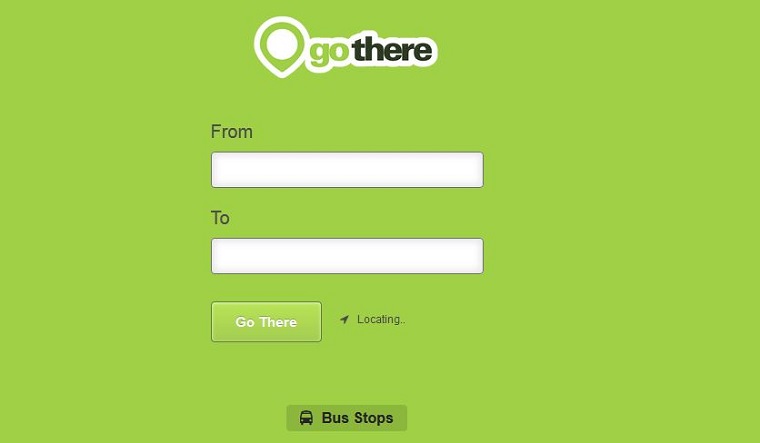 Screenshot from gothere.sg
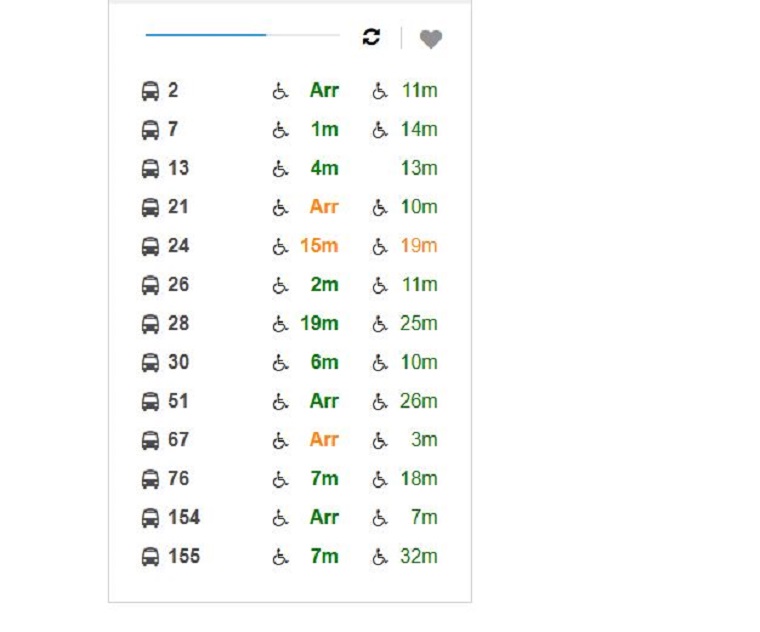
... making the interface much cleaner...
... and he also got bus timings to refresh automatically, almost in real-time.
3. And also created an ORD countdown app.
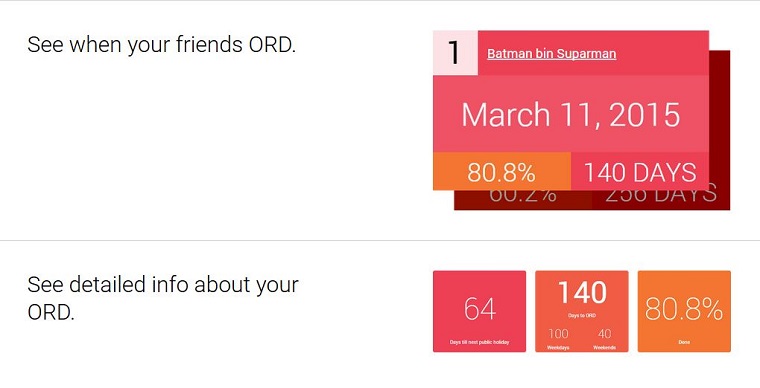 Screenshot from ORD Loh's website
We talked to Tang to better-understand his emphasis on data, as well as what awesome thing he's going to help us with next:
What is your motivation for creating data visualisations, and when did you start?
Recently, there have been countless articles written about Singapore's push to become a "smart nation", but I feel that many people don't realise that much of the data being collected has already been made public.
By visualising some of this data, I hope to give people a better idea of the datasets' scale, as well as their potential uses.
I started practising data visualisation several years ago, but never published some of them as I felt they weren't polished enough.
Your data derives mainly from the government database; are there any other major sources of data apart from governmental sources?
Not right now. Most of the datasets I use are from data.gov.sg and LTA's Datamall. It seems that it is mostly government agencies that have the resources to collect data on such a scale.
Do you have any future projects planned in the meantime?
I have several data visualisation projects planned, including a visualisation of gym usage patterns in Singapore.
The latest project you undertook, the taxi heat map, is incredibly useful for people to visualise the taxi situation at any one time. Do you feel there is a way for taxi companies to use that data map?
Sure. If taxi companies can utilise the data in a way that helps supply meet demand, it would definitely help improve customer satisfaction. A good example of this is Uber's surge pricing model, which draws drivers to areas where demand heavily outstrips supply.
What do you ultimately wish to achieve by plotting these types of data graphs?
I hope that the general public will start to realise the existence of these datasets, as well as their potential usefulness and applications. Furthermore, I hope it attracts more government agencies to make their datasets public. The team behind data.gov.sg has been putting loads of effort into making these two things happen, and I feel that their efforts should be recognised.
Related articles:
Amazing heat map by 1st-year NUS student shows all your taxis are in Changi Airport
Top image courtesy of Joseph Tang.
If you like what you read, follow us on Facebook and Twitter to get the latest updates.
If you like what you read, follow us on Facebook, Instagram, Twitter and Telegram to get the latest updates.