
The software can look intimidating. But it's also very useful — once you know your way around it.
Here are four Excel hacks, ranging from easy (for beginners) to advanced (for more practised users dealing with large amounts of data).
If you’re worried about the legitimacy of these hacks, don’t — half of them are provided by a business analytics lecturer and data analyst from PSB Academy, Nyayapati Swami.
1. Excel formulas
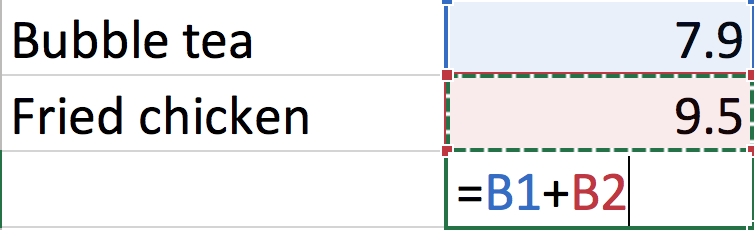
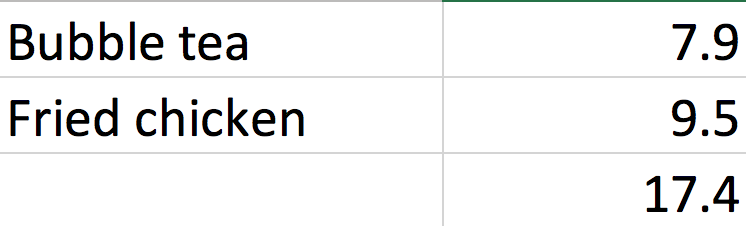
This is especially useful if you're tracking your expenses. Instead of you having to calculate the total amount for various expenditures, the software will be doing the math for you.
How to
- Select a cell (where you want the answer to appear)
- Type the equal sign (=)
- Select a cell or type its address in the selected cell.
- Enter an operator (+, -, x, /). For example, – for subtraction.
- Select the next cell in the equation, or type its address in the selected cell.
- Press Enter and you'll get the result of the calculation.
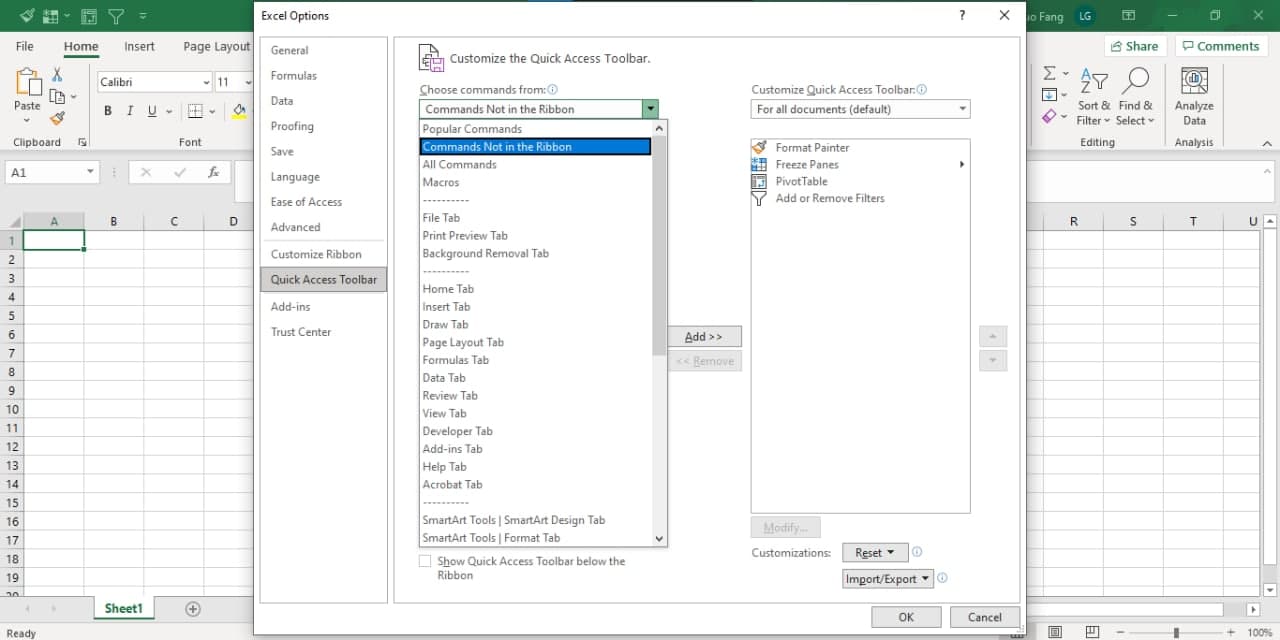
2. Quick Access Toolbar
One simple, yet under-utilised tool in Excel is the Quick Access Toolbar. With the right customisation, it can greatly speed up your work process — you can even do without a mouse.
How to
- Select the downward facing arrow at the top of the page (as image below)
- Go to More Commands
- Customise it with the commands you use most often, such as formatting cells, borders, calculate now, and more
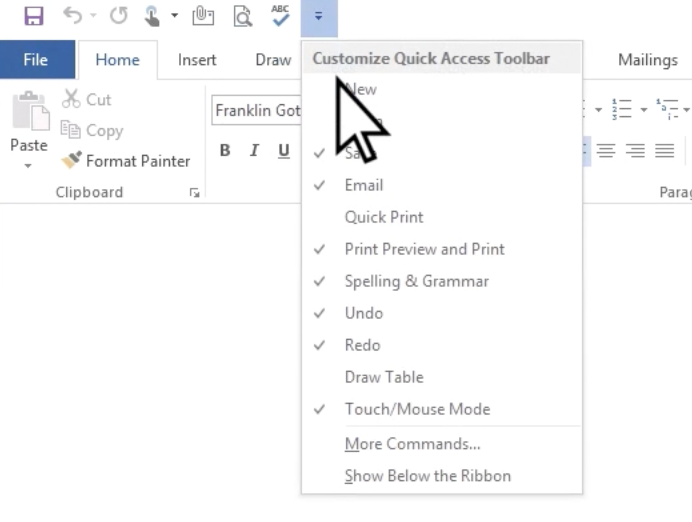 Screenshot via Microsoft
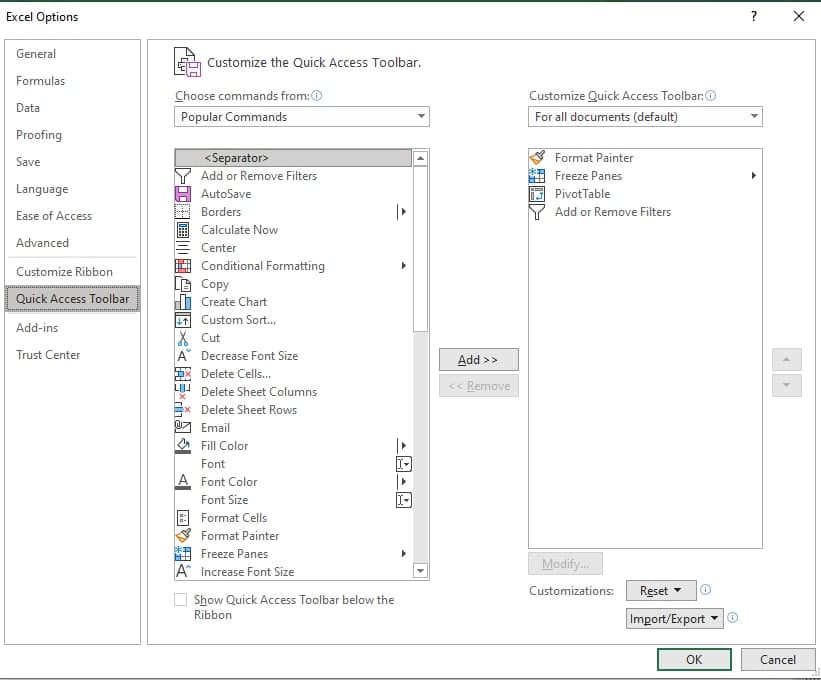
You can also add other commands not available on the ribbon. To do this, toggle the "Choose commands from" button on top, and select the drop-down you want.
3. Selecting the best trendline
Warning: these intermediate to advanced tips are from the lecturer, so expect some software navigation (but also greater functionality).
Excel provides a very simple way (the lecturer’s words, not ours) to find the trendline that can be used for a given data set.
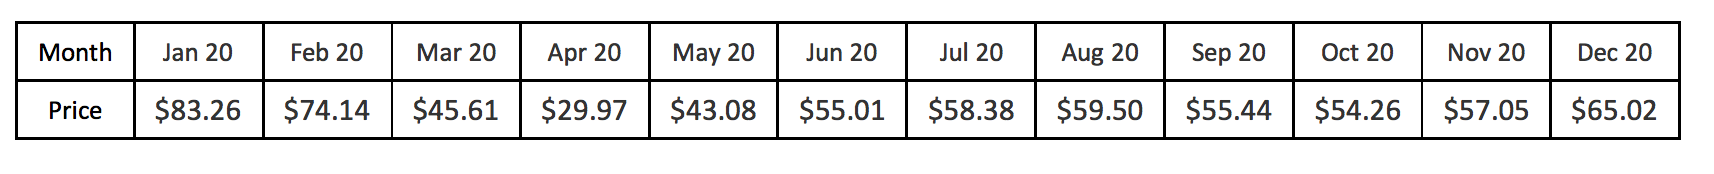
This means going from this:
To this:
How to
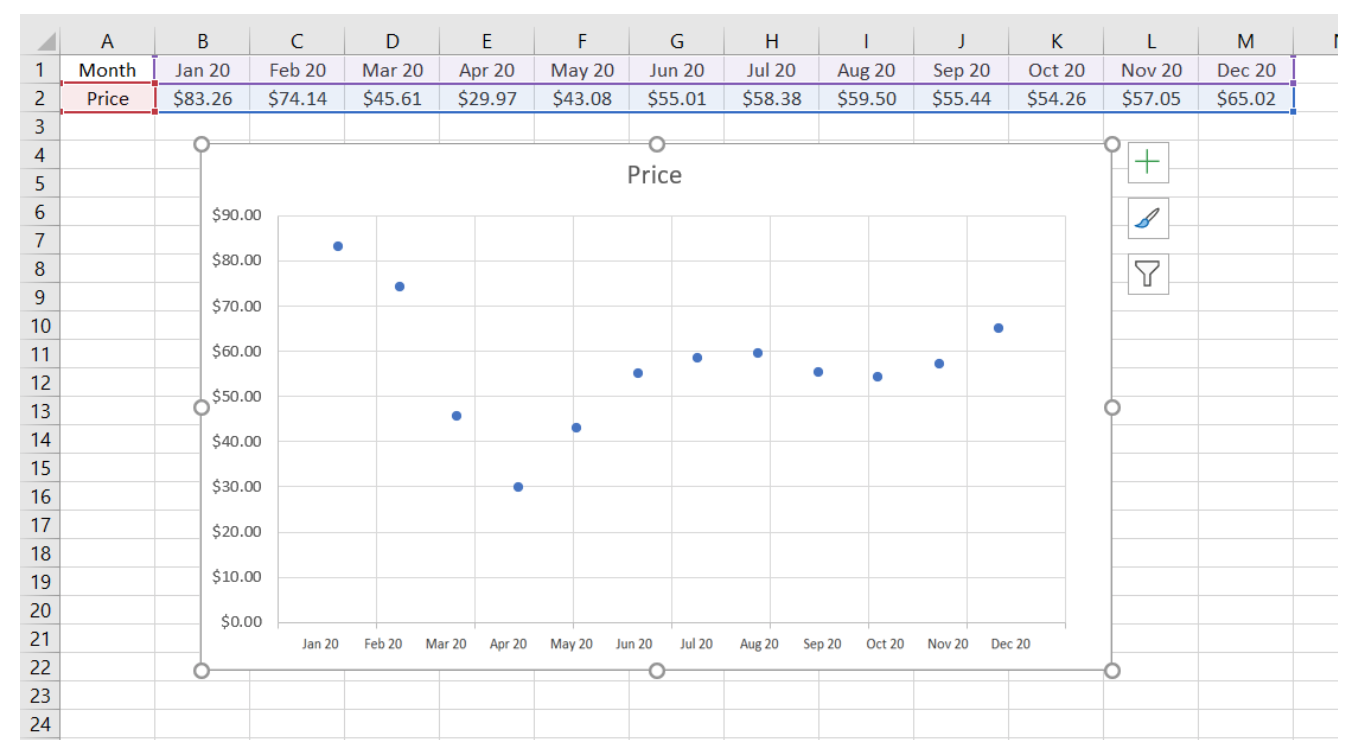
The following data of crude oil prices for the year 2020 will be used to illustrate this.
- Copy the data into an excel file.
- Select data (including the headings) --> click on insert.
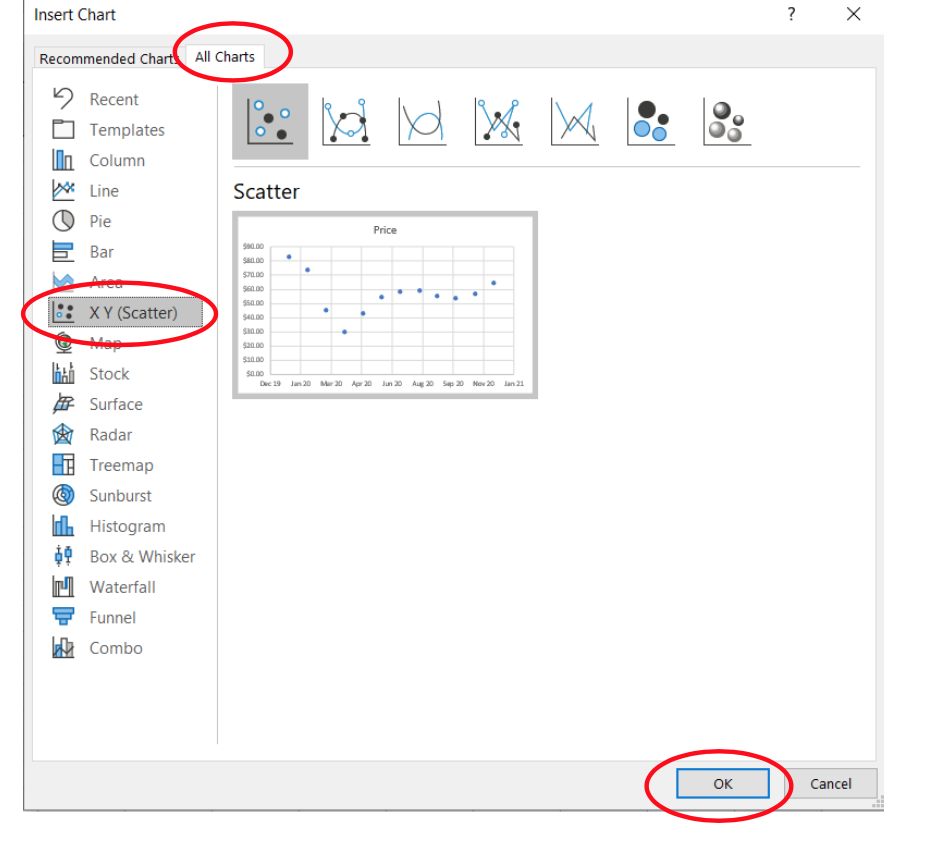
- In the Charts menu, select all charts --> choose XY Scatter --> click ok.
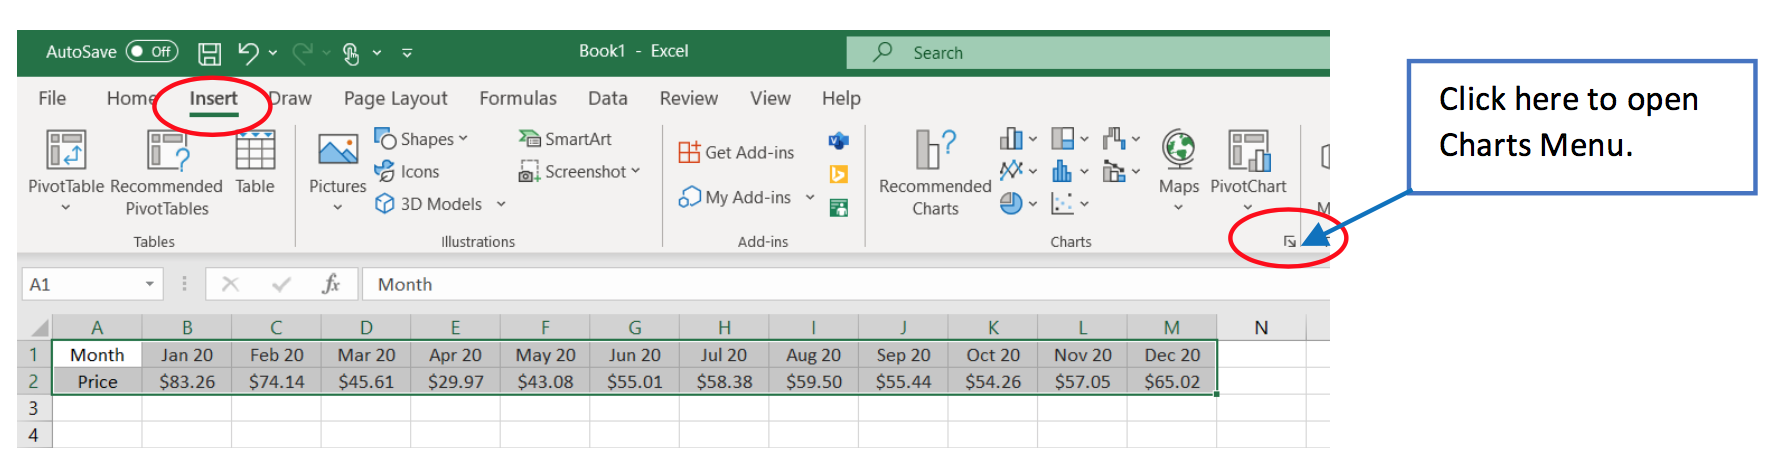
You should get this:
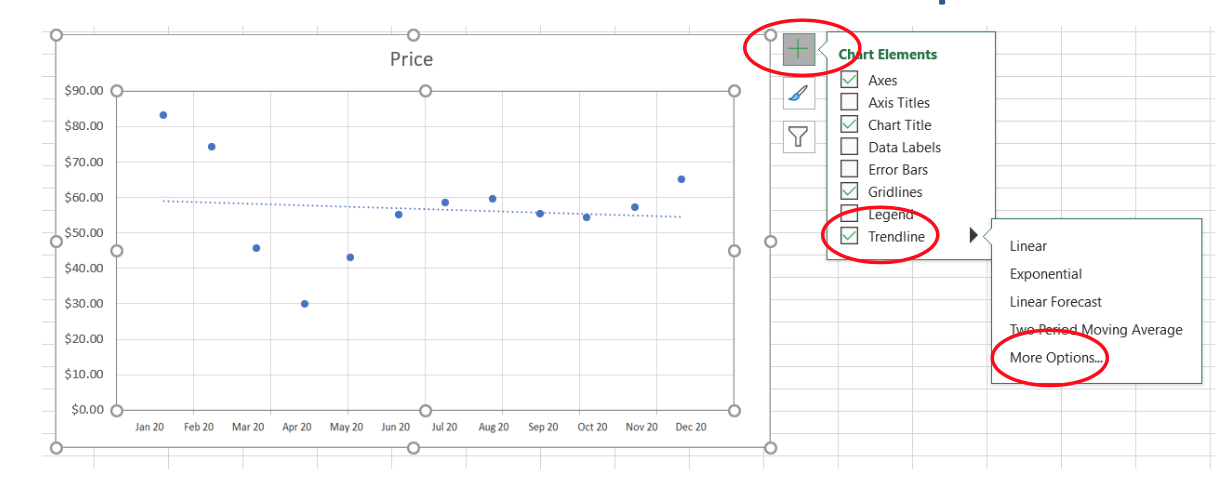
To add trendline, click on plus sign and select trendline. This will add the trendline to the graph.
Next, click on More Options.
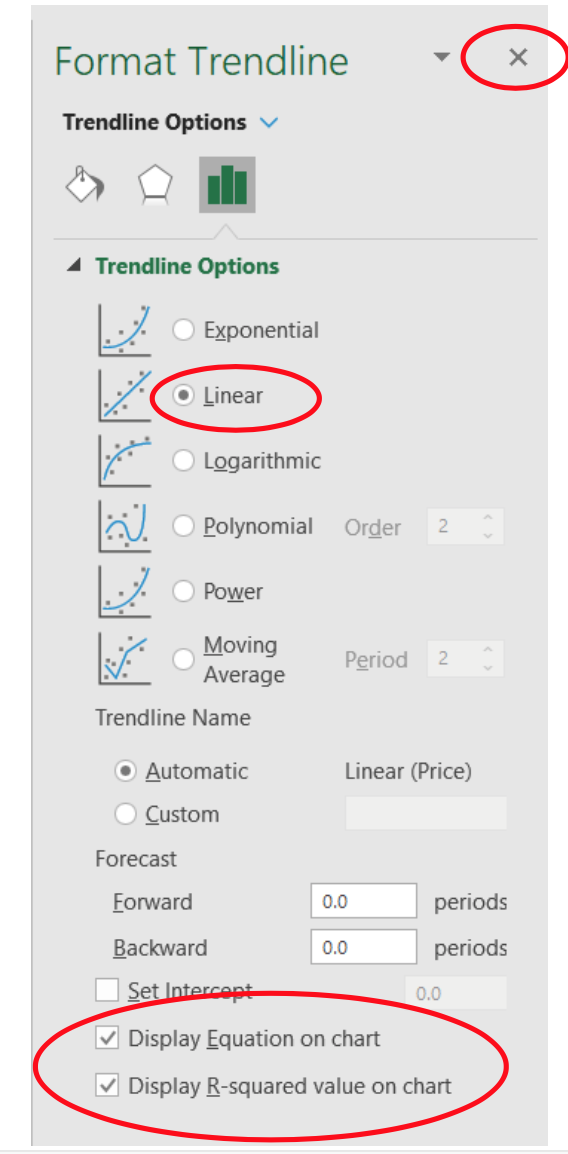
A menu will appear on the right side of your screen.
Here you can select different types of trend (exponential, linear, etc), but we're going with Linear trend.
Tick "Display equation on chart" and "Display R-squared value on chart".
Close the menu (by clicking on x).
You should get this:
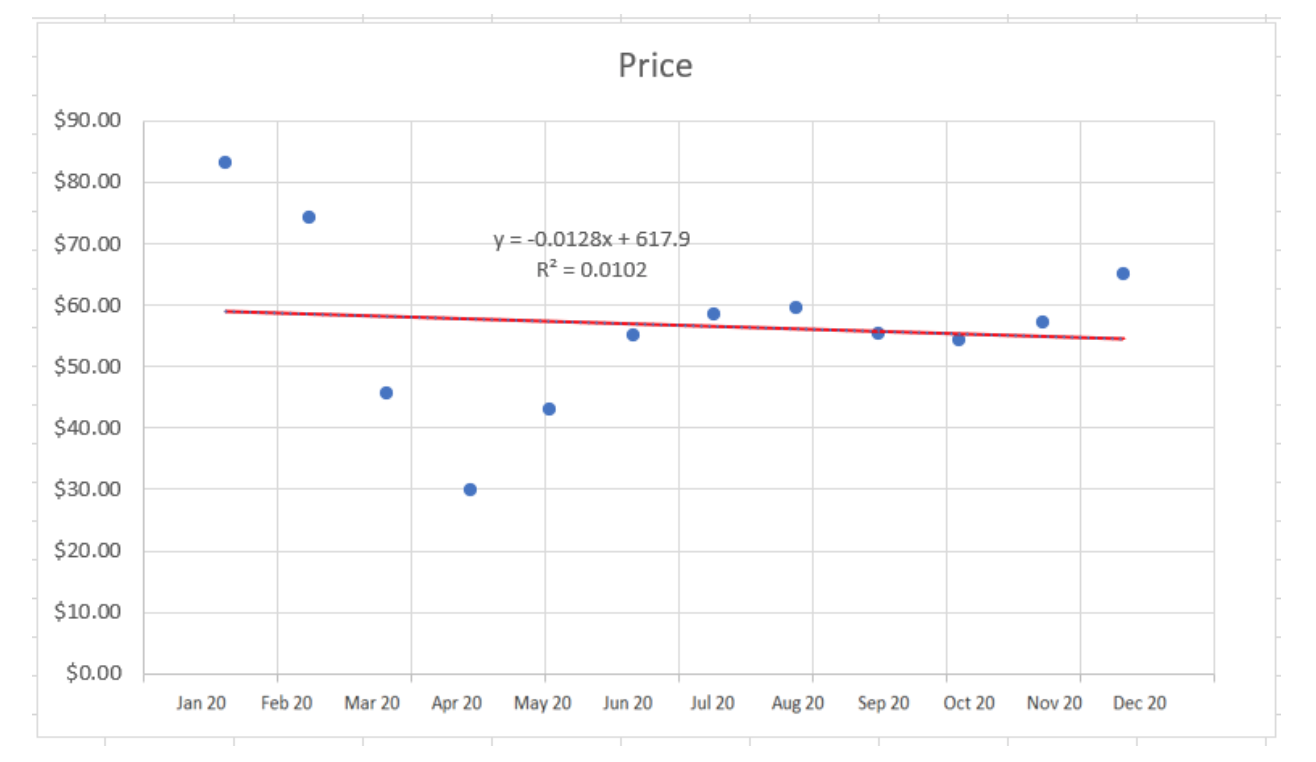
It's not much of a graph at this point, because the line is not adhering to the data.
This is happening because the data is quite scattered — otherwise, you would have been able to already infer up or down trends after this step.
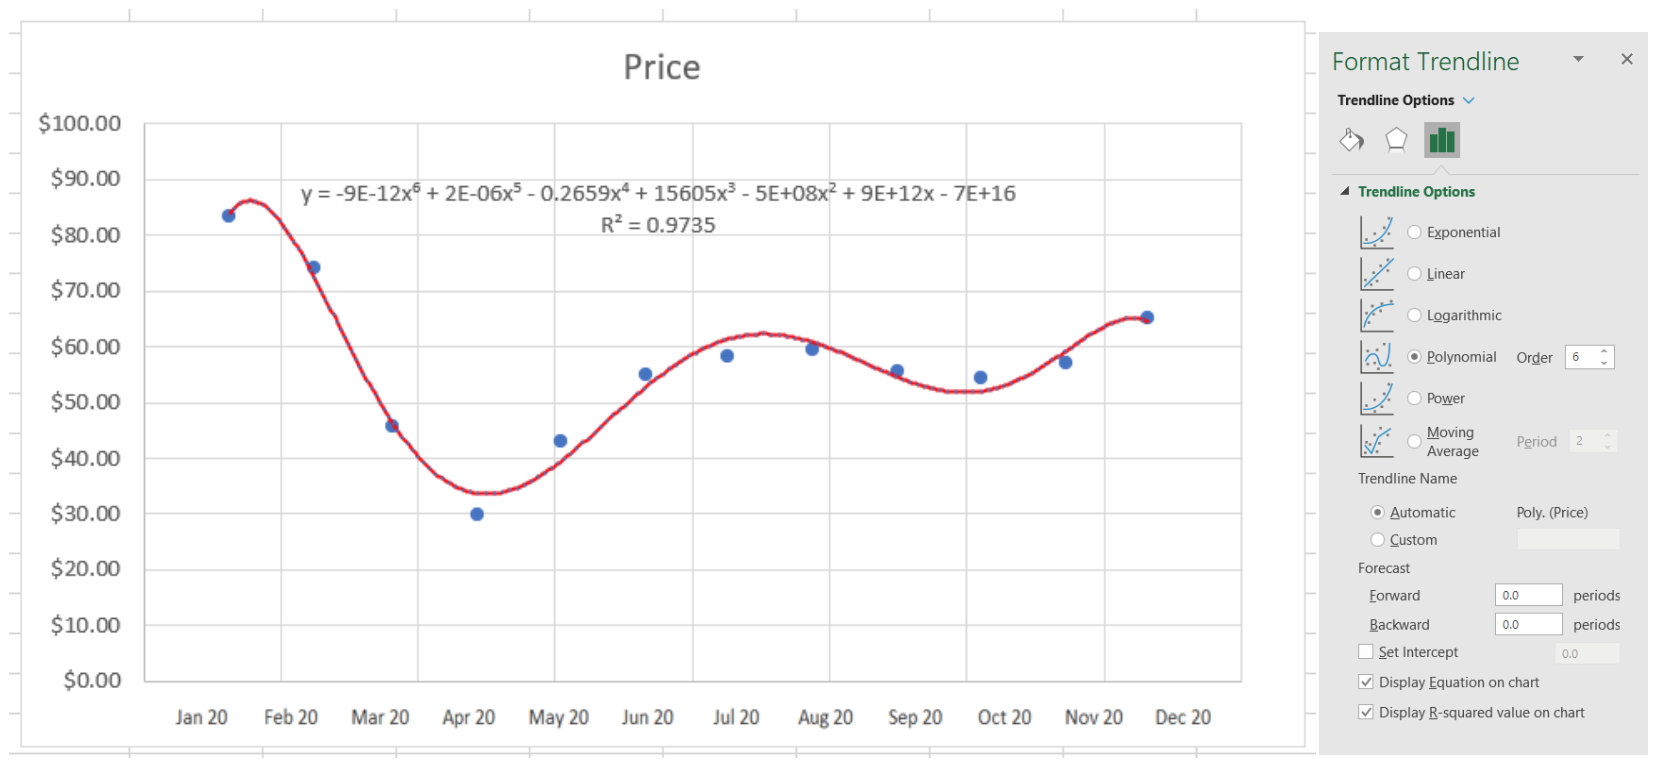
In such scenarios, we will need to adjust the value of R2 to make closer to 1.
This betters the fit of the graph so that you can discern a trend.
For instance, selecting “polynomial graph” with the order of six would be the best fit, with R2 = 0.9735.
"From this graph, it can be observed that the price for crude oil fell drastically in April which can be attributed to the effects of Covid-19, which affected travel and businesses globally," Swami explained.
Or you could use it to demonstrate a pattern in your spending habits, love life etc.
4. Cell Messaging
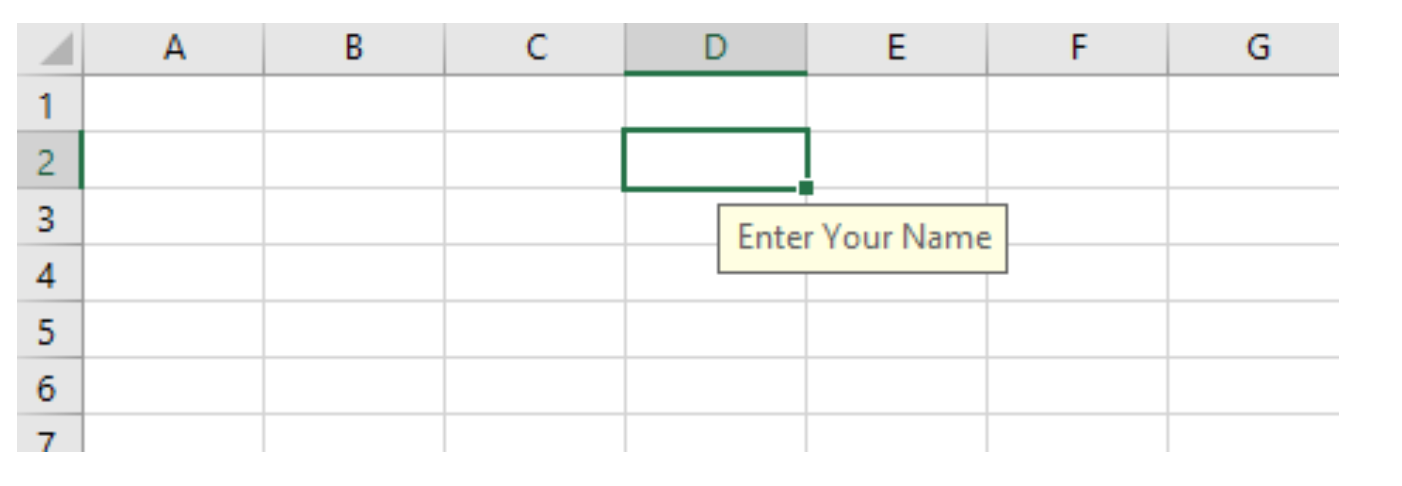
Cell messaging allows you to inform users about the information that can be entered in a particular cell.
For example, the cell can display an instruction like “Enter your name” when it is selected:
How to
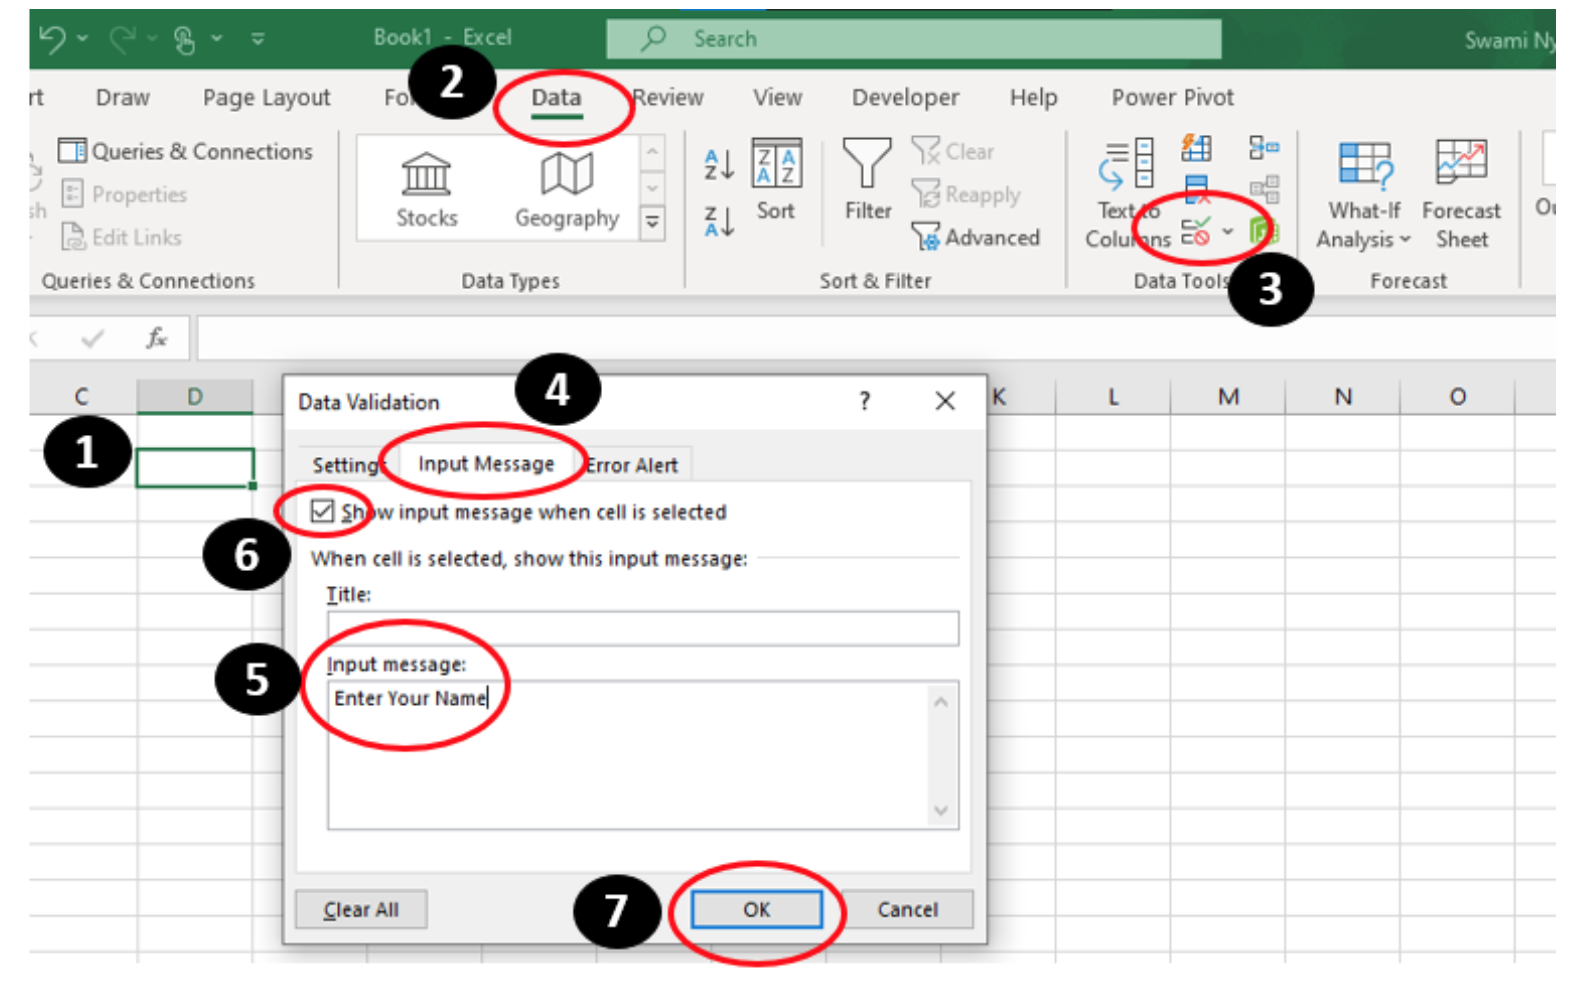
To display such a message when you click on a cell:
- Select the cell
- Go to Data Tab
- Click on Data Validation
- In the window that appears, select “input message” tab
- Type the message
- Tick the “Show input message when cell is selected"
- Click Ok
Handy for communicating with your project team mates.
Coveted skillset in post Covid-19 world
If you've learnt something new from the hacks, you might be interested in PSB Academy's new Diploma in Business Analytics.
Launched earlier this year, the 12-month course allows students to learn data analysis techniques using various software such as Microsoft Excel, IBM SPSS, and R Programming.
The practical lessons enable students to translate raw data sets into insights that support business decision making, using data-driven methods to uncover past patterns and build related predictions.
According to PSB Academy, the diploma was conceptualised due to an increase for the need of data analysts in various industries.
Citing a 2020 survey conducted by NTUC LearningHub, PSB Academy noted that data analysis skills were among the top three digital skills much coveted by local employers, in the context of surviving Covid-19 and beyond.
This includes employers from the built environment (construction, architecture, real estate, cleaning, security), essential domestic services (healthcare, education), lifestyle sectors, manufacturing, and more.
The survey explained that along with data analysis, digital marketing capabilities and project management skills have become increasingly important in helping organisations make better decisions in a fast-changing world.
According to the Ministry of Manpower, as of 2019, the median monthly gross wage for a research market analyst stands at S$4,528.
However, this figure varies on your experience and qualifications, so don’t expect to earn this sum straightaway if you’re a newbie to the industry.
If you're looking to delve into another aspect of business school, another option is PSB's Diploma in Business Administration with three specialisations:
You can check out the progression pathways here
This article made the writer a little less afraid of using Excel.
If you like what you read, follow us on Facebook, Instagram, Twitter and Telegram to get the latest updates.