[Editor's Note]: NEA has since clarified that the graph below shows a figure that is actually the Total Waste Generated in Singapore, but appeared as Total Muncipal Solid Waste (MSW) generated in the World Bank's 2017 dataset.
As MSW includes waste from households, institutions and commercial premises but excludes types such as waste from construction, industrial and mining activities, this means that the figure is "grossly inflated" according to NEA.
The agency has also written in to Bloomberg Asia and the World Bank to inform them of this issue.
Bloomberg Asia has since removed the graph.
Singapore does not produce greatest amount of solid waste per capita in the world at 1,400kg.
On June 11, Bloomberg reported the figure to be as such, citing a study by the World Bank.
It also put up a Facebook post showing the figure in the form of a graph, with Singapore at the top.
However, this post and the graph have since been removed, with Bloomberg posting the following correction in its article:
The National Environment Agency (NEA) clarified that the figure shown was the Total Waste Generated in Singapore, but appeared as Total Muncipal Solid Waste (MSW) generated in the World Bank's 2017 dataset."Corrects a chart appearing after the third paragraph that previously had incorrect data on Singapore, due to an error by the World Bank."
Given that MSW also includes waste from households, institutions and commercial premises, but excludes types such as waste from construction, industrial and mining activities, this means that the figure is "grossly inflated" according to NEA.
So how does Singapore's waste look like in absolute figures?
According to the National Environment Agency (NEA), Singapore generated about 7.23 million tonnes of solid waste for 2019, of which 4.25 million tonnes were recycled.
Compared to 2018, the amount of solid waste generated dropped by 6 per cent, while the amount recycled decreased from 61 per cent to 59 per cent.
NEA further noted that the drop in recycling is largely the result of a drop in the recycling rate of paper.
This is due to the market for recycled paper being affected by shrinking export markets and a lowered demand for printing paper from greater digitalisation.
As for the breakdown of the waste generated, and recycled, waste from metals, construction, and scrap tyres saw some of the largest amounts of waste generated, as well as the highest rates of recycling at over 98 per cent.
Meanwhile, plastics saw the lowest rate of recycling with only 4 per cent of 930,000 tonnes recycled, along with textile and leather waste, which also saw only 4 per cent of 168,000 tonnes of waste recycled.
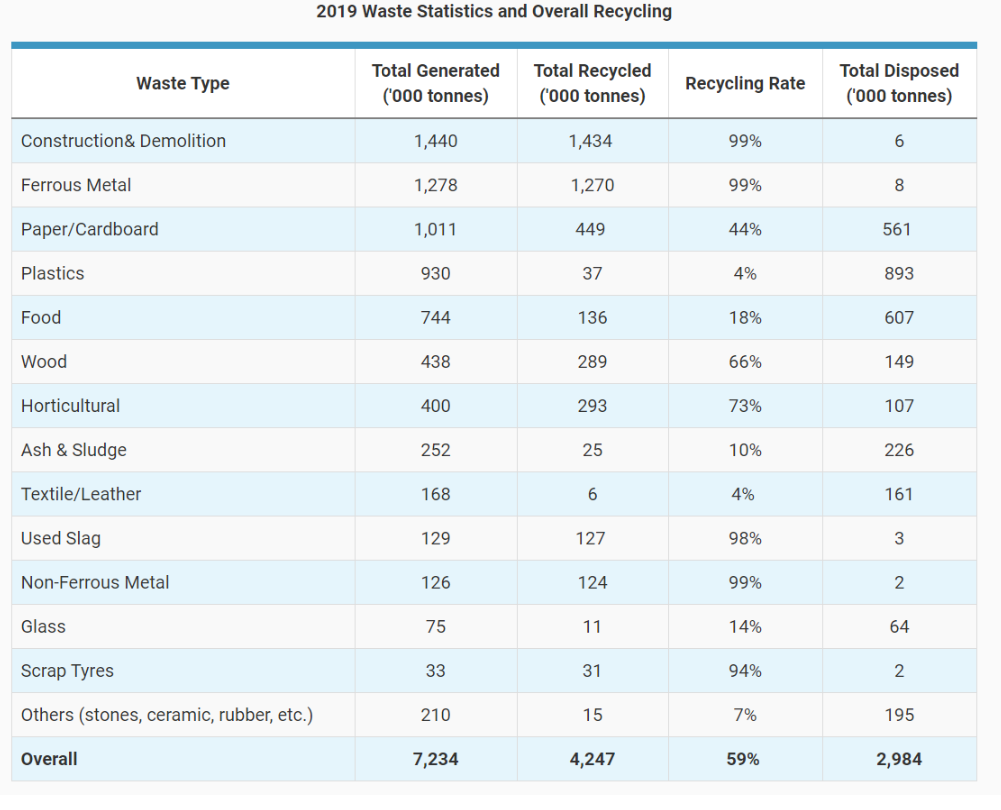 Source: Screenshot from NEA website
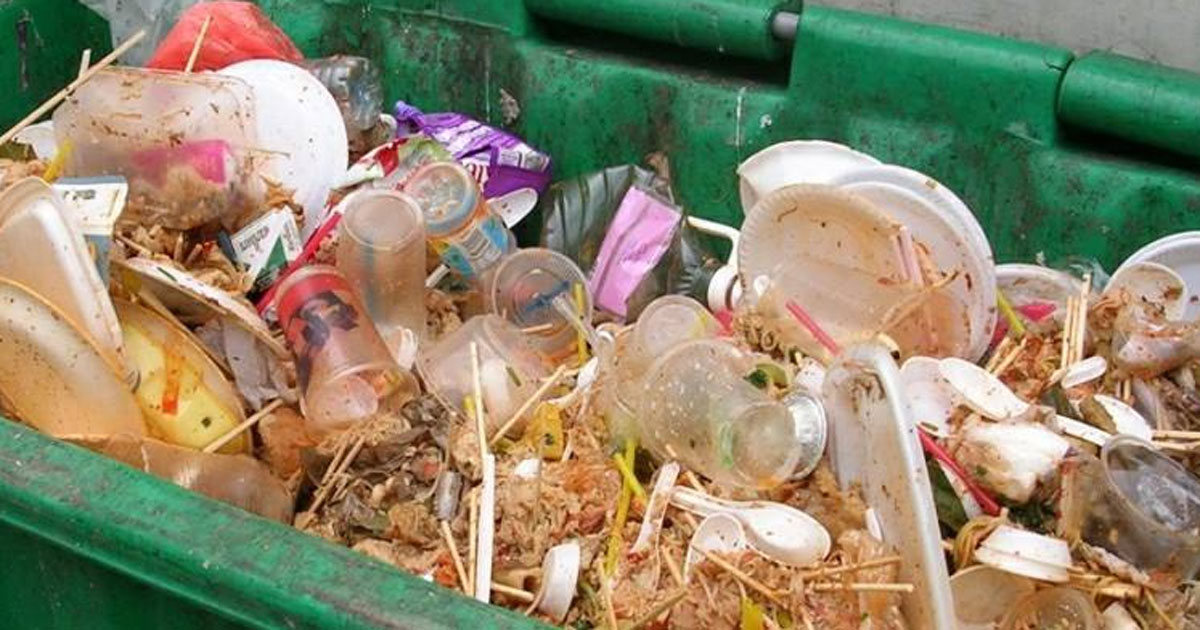
The amount of waste generated for plastic in particular is expected to rise given that an extra 1.33 million kg of plastic waste was generated as a result of takeaway and delivery meals this two-month circuit breaker period, a local survey found.
Top image from Zero Waste Singapore Facebook
If you like what you read, follow us on Facebook, Instagram, Twitter and Telegram to get the latest updates.