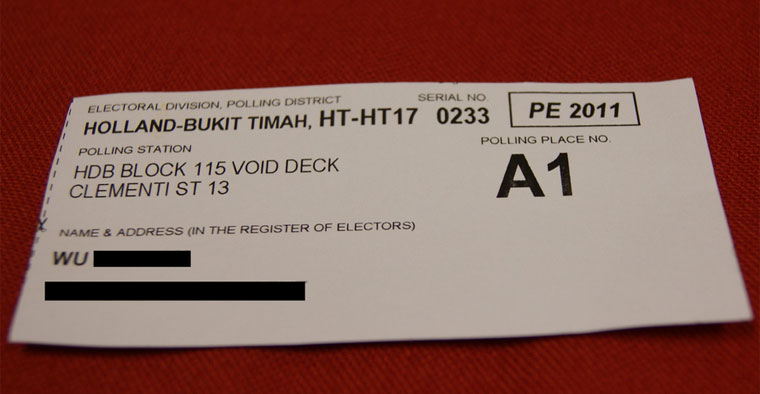
Now that the GE2015 votes have been tallied, here is how the spoilt votes and absenteeism numbers look like at a glance:
SMC with highest percentage of non-votes: Mountbatten SMC (11.9%)
GRC with highest percentage of non-votes: Tanjong Pagar GRC (11.0%)
SMCs with the lowest percentage of non-votes:
Punggol East SMC: 4.95%
Sengkang West SMC: 6.11%
Hougang SMC: 6.40%
What other observations can you make based on the table below?
- Tanjong Pagar GRC residents got to vote for the first time in a long time but they did not seem like they wanted to participate?
- New estates tend to have younger voters who are more keen to exercise their vote?
- Were Mountbatten SMC residents faced with such a tough choice that a significant portion abstained? Or were they working overseas/ holidaying due to the mid-to-high income levels of those residents?
- Were Radin Mas SMC voters also faced with a tough choice?
Total rejected votes: 47,315
Total non-voters: 158,595
| SMC/ GRC | Rejected votes | Did not vote | Number of
electors | % non-votes (Rejected + Did not vote) |
| Aljunied | 1,638 | 9,258 | 148,142 | 7.36% |
| Ang Mo Kio | 4,887 | 11,058 | 187,771 | 8.49% |
| Bishan-Toa Payoh | 2,411 | 10,001 | 129,975 | 9.55% |
| Bukit Batok | 545 | 1,593 | 27,077 | 7.90% |
| Bukit Panjang | 626 | 1,613 | 34,317 | 6.52% |
| Chua Chu Kang | 2,949 | 6,791 | 119,931 | 8.12% |
| East Coast | 1,008 | 7,582 | 99,118 | 8.67% |
| Fengshan | 290 | 1,581 | 23,427 | 7.99% |
| Holland-Bukit Timah | 1,500 | 8,981 | 104,491 | 10.0% |
| Hong Kah North | 551 | 1,361 | 28,145 | 6.79% |
| Hougang | 236 | 1,306 | 24,097 | 6.40% |
| Jalan Besar | 1,549 | 7,147 | 102,540 | 8.48% |
| Jurong | 2,432 | 8,138 | 130,498 | 8.10% |
| Macpherson | 415 | 1,828 | 28,511 | 7.87% |
| Marine Parade | 1,682 | 11,994 | 146,244 | 9.35% |
| Marsiling-Yew Tee | 2,134 | 5,823 | 107,599 | 7.40% |
| Mountbatten | 333 | 2,528 | 24,143 | 11.9% |
| Nee Soon | 1,731 | 7,565 | 132,289 | 7.03% |
| Pasir Ris-Punggol | 5,310 | 10,557 | 187,396 | 8.475 |
| Pioneer | 658 | 1,228 | 25,458 | 7.41% |
| Potong Pasir | 224 | 1,249 | 17,407 | 8.46% |
| Punggol East | 379 | 1,329 | 34,466 | 4.95% |
| Radin Mas | 768 | 1,950 | 28,906 | 9.40% |
| Sembawang | 3,769 | 7,170 | 144,672 | 7.56% |
| Sengkang West | 417 | 1,422 | 30,119 | 6.11% |
| Tampines | 3,638 | 7,758 | 143,518 | 7.94% |
| Tanjong Pagar | 2,405 | 11,965 | 130,752 | 11.0% |
| West Coast | 2,415 | 6,402 | 99,300 | 8.88% |
| Yuhua | 388 | 1,426 | 22,617 | 8.02% |
Click here to go to our GE2015 microsite for the juiciest election-related news on Mothership.sg.
If you like what you read, follow us on Facebook and Twitter to get the latest updates.
If you like what you read, follow us on Facebook, Instagram, Twitter and Telegram to get the latest updates.
